LLM Evaluation and Observability Using Evidently
Large Language Models (LLMs) are revolutionizing technology, driving applications like chatbots, content generators, and more. But despite their power, LLMs can be unpredictable—hallucinating facts, giving inconsistent answers, or degrading over time. To build trust and ensure reliability, evaluating and monitoring LLMs is essential.
In this blog, we’ll dive into how Evidently, an open-source Python library, empowers you to evaluate and observe LLMs with practical tools and metrics. Whether you’re testing a prototype or monitoring a production system, this guide has you covered.
Why Evaluate and Monitor LLMs?
LLMs aren’t flawless. Here’s why keeping tabs on them matters:
- Performance Drops: Model updates or shifting user inputs can quietly erode quality.
- Hallucinations: LLMs might confidently invent facts, misleading users.
- Inconsistency: The same question might get wildly different responses.
- User Trust: Quirky or incorrect answers can alienate users fast.
Example: Picture a financial chatbot that occasionally gives faulty tax advice. Without evaluation, those errors could slip through, causing real harm. Monitoring spots these issues before they escalate.
Meet Evidently
Evidently is an open-source Python library designed for machine learning and LLM observability. With over 25 million downloads, it’s trusted for:
- Text-Specific Metrics: Analyze attributes like length, sentiment, or custom qualities.
- Dashboards: Visualize trends and insights effortlessly.
- Flexibility: Customize evaluations to fit your use case.
Setting Up Evidently:
Here’s how to get started with Evidently for LLM evaluation.
Step 1: Install the Library
To unlock LLM-specific features, use this command:
1pip install evidently[llm]
Note: The [llm] extra ensures you get the tools tailored for LLMs.
Step 2: Configure API (Optional)
If you’re using an LLM like OpenAI to judge responses (e.g., for “LLM-as-a-judge” metrics), set your API key:
1import os
2os.environ["OPENAI_API_KEY"] = "your_api_key_here"
Replace "your_api_key_here" with your key from OpenAI’s platform.
Step 3: Import Modules
Use these imports for Evidently’s latest API:
1import pandas as pd
2import numpy as np
3from evidently.future.datasets import Dataset, DataDefinition
4from evidently.future.descriptors import (
5    TextLength,  # For measuring response length
6    Sentiment,   # For analyzing sentiment
7    DeclineLLMEval  # For detecting declined answers
8)
9from evidently.future.report import Report
10from evidently.future.presets import TextEvals
Key Evaluation Metrics: What to Measure
To assess LLMs effectively, focus on these metrics (especially useful for Retrieval-Augmented Generation (RAG) systems too):
- TextLength: Flags responses that are too brief or overly verbose.
- Sentiment: Detects positive, negative, or neutral tones to catch unintended vibes.
- DeclineLLMEval: Identifies refusals like “I don’t know,” revealing model limits.
- Faithfulness: Ensures answers stick to provided context, avoiding fabrications.
- Context Relevancy: Confirms retrieved info matches the query.
- Correctness: Compares responses to expected answers.
Why these? Each targets a common LLM flaw, ensuring comprehensive quality checks.
Building a Golden Dataset: Your Benchmark
A golden dataset is a set of questions paired with expert-verified answers—a gold standard for evaluation.
Why It’s Critical
- Quality Check: Benchmarks accuracy and relevance.
- Consistency: Tracks performance over time.
- User Focus: Aligns responses with real needs.
How to Create It
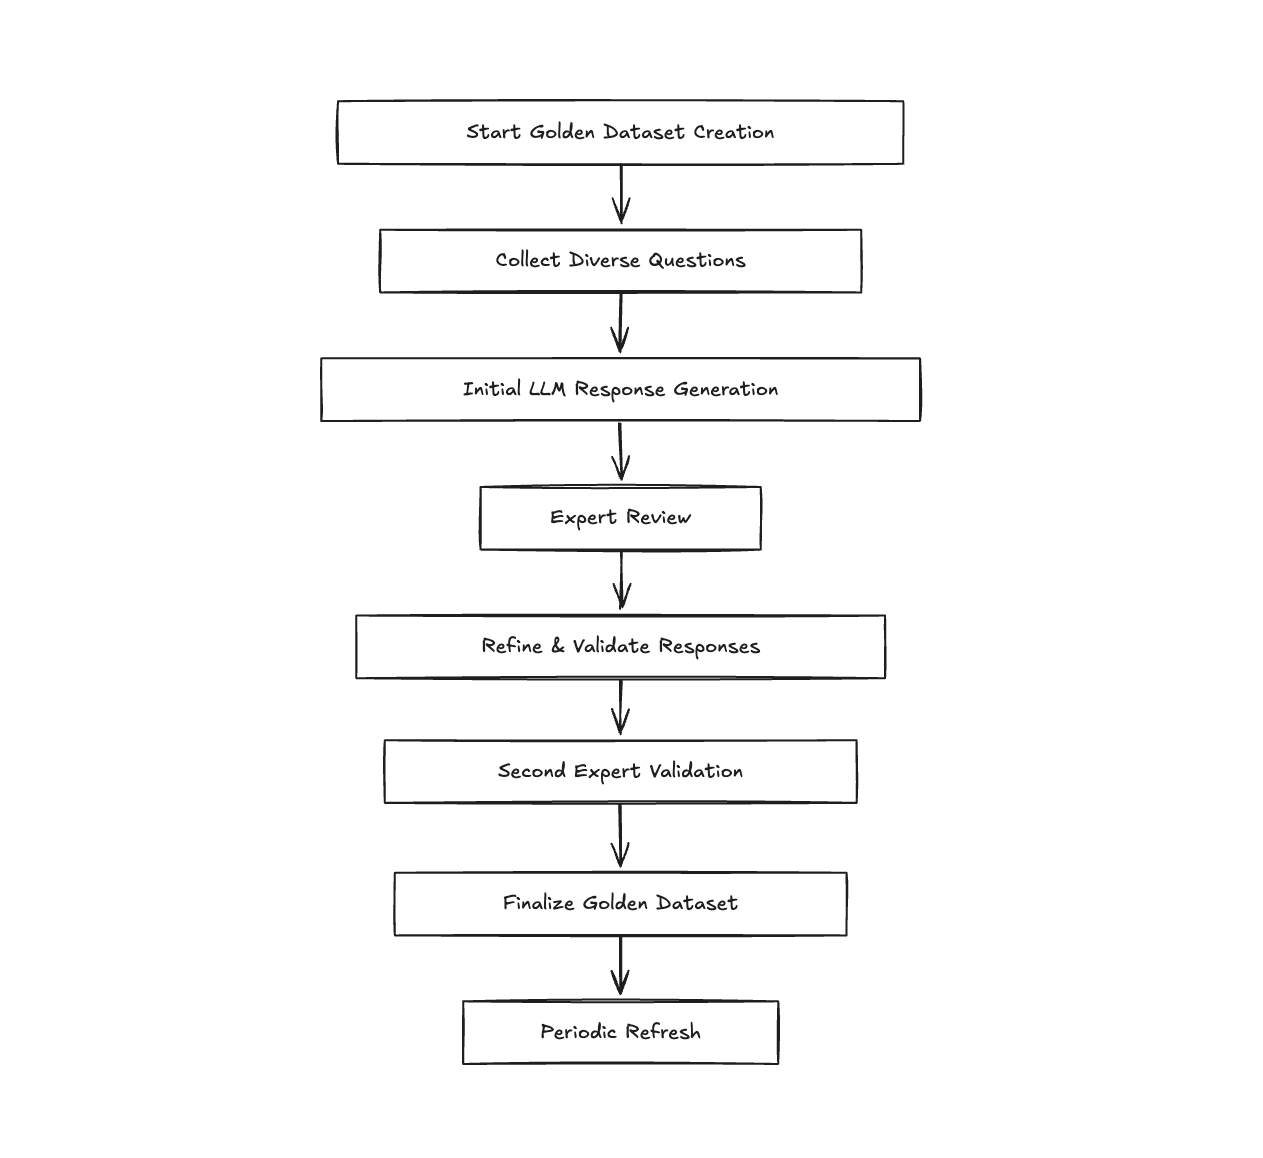
- Write Questions: Collect 150+ diverse, realistic questions (e.g., “How do I handle imbalanced datasets?”).
- Draft Responses (Optional): Use your LLM to generate initial answers.
- Expert Review: Have domain experts provide accurate responses.
- Finalize: A second expert polishes the set.
Tip: Refresh your dataset periodically to reflect evolving use cases.
Hands-On: Evaluating Your LLM
Let’s evaluate an LLM designed for machine learning engineers with Evidently.
Step 1: Prepare Data
Create a dataset with ML-related questions, LLM answers, and reference responses:
1import pandas as pd
2
3# Define a dataset with ML-specific questions, LLM responses, and ground truth answers
4data = {
5    "question": [
6        "How do I handle imbalanced datasets in classification?",
7        "What’s the difference between L1 and L2 regularization?",
8        "Can you explain the bias-variance tradeoff?"
9    ],
10    "answer": [
11        "You can use techniques like oversampling the minority class, undersampling the majority class, or applying SMOTE.",
12        "L1 regularization adds the absolute value of weights to the loss, while L2 adds the squared value.",
13        "I’m not equipped to provide detailed explanations on the bias-variance tradeoff."
14    ],
15    "reference": [
16        "Common methods include oversampling, undersampling, or synthetic data generation like SMOTE. Always validate the impact on model performance.",
17        "L1 regularization encourages sparsity by adding the absolute weights, while L2 discourages large weights by adding their squares.",
18        "The bias-variance tradeoff balances model complexity: high bias can underfit, high variance can overfit. Optimal models minimize total error."
19    ]
20}
21df = pd.DataFrame(data)  # Convert dictionary to pandas DataFrame for analysis
Step 2: Define Metrics
Set up your dataset with evaluation metrics:
1from evidently.future.datasets import Dataset, DataDefinition
2from evidently.future.descriptors import TextLength, Sentiment, DeclineLLMEval
3
4# Create an Evidently dataset with descriptors to score LLM responses
5eval_dataset = Dataset.from_pandas(
6    pd.DataFrame(df),  # Input DataFrame with questions, answers, and references
7    data_definition=DataDefinition(),  # Default data definition for text analysis
8    descriptors=[
9        TextLength("answer", alias="Length"),  # Measure response length in characters
10        DeclineLLMEval("answer", alias="Denials", model="gpt-4o-mini"),  # Detect refusals (outputs "OK" or "DECLINE")
11        Sentiment("answer", alias="Sentiment")
12    ]
13)
Step 3: Generate a Report
Run the evaluation and visualize results:
1from evidently.future.report import Report
2from evidently.future.presets import TextEvals
3
4# Initialize a report with TextEvals preset for text-specific metrics
5report = Report([TextEvals()])
6my_eval = report.run(eval_dataset, None)  # Run evaluation on the dataset (no reference dataset here)
7
8# Display in Jupyter notebook for interactive viewing
9my_eval
10
11# Or save as an HTML file for static sharing
12my_eval.save_html("llm_evaluation_report.html")
Monitoring LLMs in Production
Once your LLM is deployed, continuous monitoring ensures it remains reliable and performs as expected. This section outlines a high-level process for logging interactions, evaluating performance, and integrating with production monitoring tools, with detailed implementation deferred to the "Step-by-Step Implementation - Putting It Together" section.
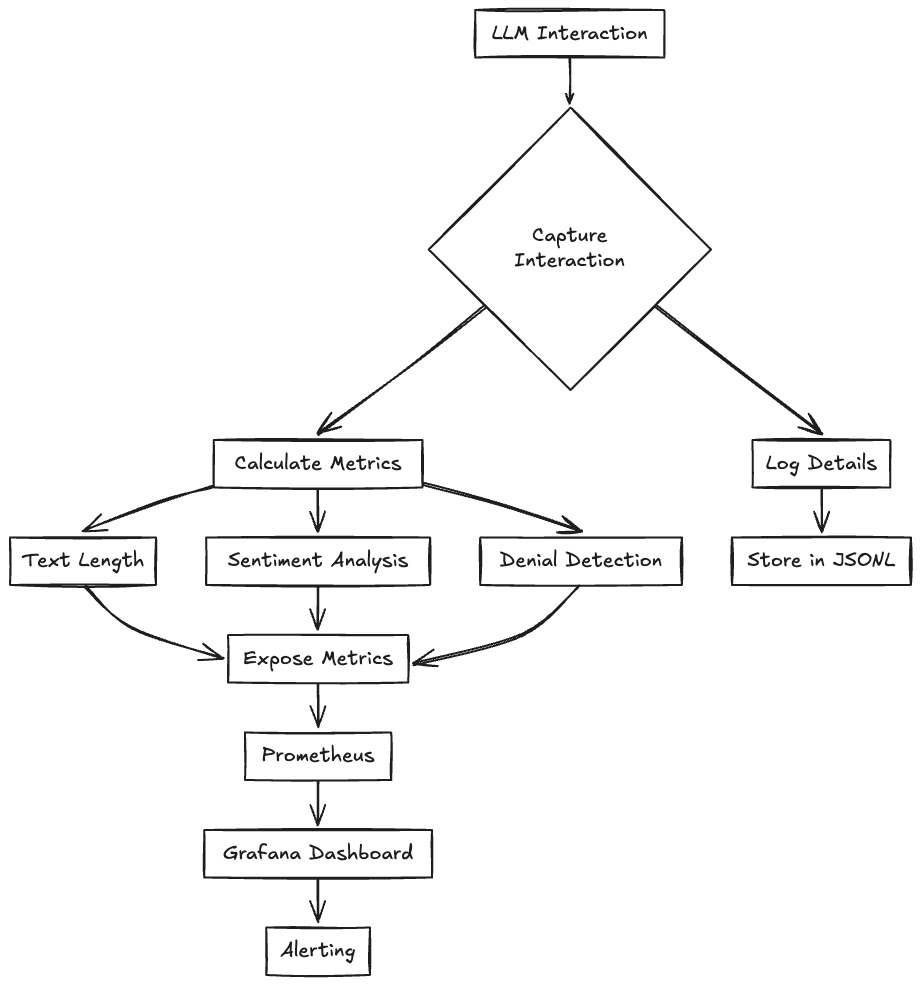
Step 1: Log Interactions
Capture every query and response to build a historical record:
1def log_llm_interaction(query, response, metrics):
2    """Log interaction with calculated metrics."""
3    # Simplified: Logs timestamp, query, response, and metrics to a JSONL file
How It Works: Logs are appended to a file (e.g., llm_logs.jsonl) with timestamps and computed metrics like length and denial status.
Why It Matters: Provides raw data for analysis and long-term tracking.
Step 2: Evaluate and Expose Metrics
Process interactions in real-time and expose metrics using OpenTelemetry:
1# Example: Update counters and histograms per request
2response_counter.add(1)
3if is_denial:
4    denial_counter.add(1)
5response_length_histogram.record(length)
How It Works: Metrics like total responses, denials, and response length distribution are updated per request and served via a Prometheus endpoint (e.g., port 8099).
Why It Matters: Real-time updates enable immediate visibility into LLM performance.
Step 3: Integrate with Monitoring Tools
Push metrics to Prometheus and visualize them in Grafana:
- Prometheus: Configure to scrape metrics from your service (e.g.,
llm-monitor:8099). - Grafana: Build dashboards to track trends and set alerts for anomalies (e.g., high denial rates).
How It Works: Metrics are collected periodically, queried for insights, and visualized or alerted upon based on predefined thresholds.
Why It Matters: Integrates LLM monitoring into a production-grade observability stack.
Project Folder Structure
Here’s the folder structure for the project, which includes all necessary files for evaluation, monitoring, and deployment:
📦llm-evidently
 ┣ 📂grafana
 ┃ ┣ 📂config
 ┃ ┃ ┣ 📜dashboards.yaml
 ┃ ┃ ┗ 📜datasources.yaml
 ┃ ┗ 📂dashboards
 ┃ ┃ ┗ 📜1860_rev31.json
 ┣ 📂llm_monitor
 ┃ ┣ 📜Dockerfile
 ┃ ┣ 📜main.py
 ┃ ┗ 📜requirements.txt
 ┣ 📂prometheus
 ┃ ┗ 📂config
 ┃ ┃ ┣ 📜alert-rules.yml
 ┃ ┃ ┗ 📜prometheus.yml
 ┣ 📜.gitignore
 ┣ 📜README.md
 ┣ 📜client.py
┗ 📜docker-compose.ymlgrafana/: Configuration and dashboard files for Grafana.llm_monitor/: Application code, Dockerfile, and dependencies.prometheus/: Configuration for Prometheus scraping and alerts.client.py: Script to test the monitoring service (detailed below).
Step-by-Step Implementation - Putting It Together
Step 1: Instrument Your Code with Prometheus Metrics
Here’s the full application code (main.py) to process LLM interactions and expose metrics:
1import json
2import pandas as pd
3from datetime import datetime
4from fastapi import FastAPI, Request
5from opentelemetry import metrics
6from opentelemetry.exporter.prometheus import PrometheusMetricReader
7from opentelemetry.metrics import set_meter_provider
8from opentelemetry.sdk.metrics import MeterProvider
9from opentelemetry.sdk.resources import SERVICE_NAME, Resource
10import logging
11from evidently.future.datasets import Dataset, DataDefinition
12from evidently.future.descriptors import TextLength, DeclineLLMEval, Sentiment
13from prometheus_client import start_http_server
14
15# Start Prometheus client
16start_http_server(port=8099, addr="0.0.0.0")
17
18# Configure logging
19logging.basicConfig(level=logging.INFO, format="%(asctime)s - %(levelname)s - %(message)s")
20
21# Set up OpenTelemetry metrics
22resource = Resource(attributes={SERVICE_NAME: "llm-monitor"})
23reader = PrometheusMetricReader()
24provider = MeterProvider(resource=resource, metric_readers=[reader])
25set_meter_provider(provider)
26meter = metrics.get_meter("llm_monitor", "0.1.0")
27
28# Create metrics instruments
29denial_counter = meter.create_counter(
30    name="llm_denials_total",
31    description="Total number of denied responses",
32    unit="1"
33)
34response_counter = meter.create_counter(
35    name="llm_responses_total",
36    description="Total number of processed responses",
37    unit="1"
38)
39response_length_histogram = meter.create_histogram(
40    name="llm_response_length_chars",
41    description="Distribution of response lengths in characters",
42    unit="characters"
43)
44
45app = FastAPI()
46
47def process_interaction(query: str, response: str):
48    """Process single interaction and return metrics"""
49    df = pd.DataFrame({
50        "question": [query],
51        "answer": [response]
52    })
53
54    eval_dataset = Dataset.from_pandas(
55        df,
56        data_definition=DataDefinition(),
57        descriptors=[
58            TextLength("answer", alias="Length"),
59            DeclineLLMEval("answer", alias="Denials", model="gpt-4o-mini"),
60            Sentiment("answer", alias="Sentiment")
61        ]
62    )
63
64    scored_df = eval_dataset.as_dataframe()
65    return scored_df.iloc[0]
66
67def log_llm_interaction(query, response, metrics):
68    """Log interaction with calculated metrics"""
69    log_entry = {
70        "timestamp": datetime.now().isoformat(),
71        "query": query,
72        "response": response,
73        "metrics": {
74            "length": metrics["Length"],
75            "denial": metrics["Denials"],
76            "sentiment": metrics["Sentiment"]
77        }
78    }
79    with open("llm_logs.jsonl", "a") as f:
80        f.write(json.dumps(log_entry) + "\n")
81    logging.info(f"Processed interaction: {query[:30]}...")
82
83@app.post("/generate")
84async def generate_response(request: Request):
85    data = await request.json()
86    query = data.get("query")
87
88    if not query:
89        return {"error": "Missing query parameter"}
90
91    # Generate response - REPLACE THIS WITH YOUR ACTUAL LLM CALL
92    response = "This is a sample response to: " + query
93
94    # Process metrics
95    try:
96        metrics = process_interaction(query, response)
97        is_denial = metrics["Denials"] == "DECLINE"
98        length = int(metrics["Length"])
99        sentiment = float(metrics["Sentiment"])
100
101        # Update metrics
102        response_counter.add(1)
103        if is_denial:
104            denial_counter.add(1)
105        response_length_histogram.record(length)
106
107        # Log interaction
108        log_llm_interaction(query, response, {
109            "Length": length,
110            "Denials": "DECLINE" if is_denial else "OK",
111            "Sentiment": sentiment
112        })
113
114        return {
115            "generated_response": response,
116            "metrics": {
117                "denial": is_denial,
118                "length": length,
119                "sentiment": sentiment
120            }
121        }
122
123    except Exception as e:
124        logging.error(f"Error processing request: {str(e)}")
125        return {"error": "Metrics processing failed", "details": str(e)}
126
127if __name__ == "__main__":
128    import uvicorn
129    uvicorn.run(app, host="0.0.0.0", port=8000)
Step 2: Create a Dockerfile
1FROM python:3.9-slim
2
3WORKDIR /app
4
5COPY requirements.txt /app
6
7RUN pip install --upgrade pip
8
9RUN pip install -r requirements.txt --no-cache-dir
10
11COPY main.py /app
12
13CMD ["uvicorn", "main:app", "--host", "0.0.0.0", "--port", "8000"]
Step 3: Define Requirements
Create requirements.txt:
1evidently[llm]
2loguru==0.7.0
3fastapi==0.96.0
4uvicorn[standard]==0.22.0
5python-multipart==0.0.6
6prometheus-client==0.17.1
7opentelemetry-api==1.19.0
8opentelemetry-sdk==1.19.0
9opentelemetry-instrumentation-asgi==0.40b0
10opentelemetry-instrumentation-fastapi==0.40b0
11opentelemetry-instrumentation-requests==0.40b0
12opentelemetry-instrumentation-logging==0.40b0
13opentelemetry-exporter-jaeger==1.19.0
14opentelemetry-exporter-otlp-proto-grpc==1.19.0
15opentelemetry-exporter-prometheus==1.12.0rc1
16pandas
Step 4: Configure Prometheus
Create prometheus.yml:
1global:
2  scrape_interval: 10s
3  evaluation_interval: 10s
4
5scrape_configs:
6  - job_name: 'llm-monitor'
7    scrape_interval: 10s
8    static_configs:
9      - targets: ['llm-monitor:8099']  # Docker service name
10
11  - job_name: 'prometheus'
12    static_configs:
13      - targets: ['localhost:9090']
14
15rule_files:
16  - alert-rules.yml
Create alert-rules.yml:
1groups:
2- name: llm_alerts
3  rules:
4  - alert: HighLLMDenialRate
5    expr: llm_denials_total / llm_responses_total > 0.10
6    for: 1m
7    labels:
8      severity: warning
9    annotations:
10      summary: "High denial rate detected ({{ $value }})"
11  - alert: LowLLMResponseLength
12    expr: histogram_quantile(0.5, sum(rate(llm_response_length_chars_bucket[5m])) by (le)) < 50
13    for: 1m
14    labels:
15      severity: warning
16    annotations:
17      summary: "Low median response length ({{ $value }} characters)"
Step 5: Set Up Docker Compose
Create docker-compose.yml:
1version: '3.8'
2
3networks:
4  monitoring:
5    driver: bridge
6
7volumes:
8  llm_logs:
9  prometheus_data:
10  grafana_data:
11
12services:
13  llm-monitor:
14    build:
15      context: ./llm_monitor
16      dockerfile: Dockerfile
17    container_name: llm-monitor
18    restart: unless-stopped
19    ports:
20      - "8000:8000"  # FastAPI app
21    networks:
22      - monitoring
23    environment:
24      - OPENAI_API_KEY=your-api-key-here
25
26  prometheus:
27    image: prom/prometheus:v2.38.0
28    container_name: prometheus
29    restart: unless-stopped
30    volumes:
31      - prometheus_data:/prometheus
32      - ./prometheus/config/prometheus.yml:/etc/prometheus/prometheus.yml
33      - ./prometheus/config/alert-rules.yml:/etc/prometheus/alert-rules.yml
34    command:
35      - '--config.file=/etc/prometheus/prometheus.yml'
36      - '--storage.tsdb.path=/prometheus'
37      - '--web.console.libraries=/etc/prometheus/console_libraries'
38      - '--web.console.templates=/etc/prometheus/consoles'
39      - '--storage.tsdb.retention.time=20h'
40      - '--web.enable-lifecycle'
41    ports:
42      - "9090:9090"
43    networks:
44      - monitoring
45
46  grafana:
47    image: grafana/grafana:9.0.5
48    container_name: grafana
49    restart: unless-stopped
50    volumes:
51      - grafana_data:/var/lib/grafana
52      - ./grafana/config/dashboards.yaml:/etc/grafana/provisioning/dashboards/dashboards.yaml:ro
53      - ./grafana/config/datasources.yaml:/etc/grafana/provisioning/datasources/datasource.yaml:ro
54      - ./grafana/dashboards:/opt/grafana/dashboards
55    environment:
56      - GF_SECURITY_ADMIN_USER=fsds
57      - GF_SECURITY_ADMIN_PASSWORD=fsds
58    ports:
59      - "3000:3000"
60    networks:
61      - monitoring
62    healthcheck:
63      test: ["CMD-SHELL", "curl -f localhost:3000/api/health && echo 'ready'"]
64      interval: 10s
65      retries: 10
Step 6: Test with Client Script
Create client.py to test the monitoring service:
1import requests
2import time
3from faker import Faker
4
5fake = Faker()
6
7# Base URL of your monitoring service
8BASE_URL = "http://localhost:8000"
9
10def test_normal_response():
11    """Test with normal, non-denied responses"""
12    for i in range(5):
13        query = fake.sentence()
14        data = {"query": query}
15
16        print(f"\nSending normal request {i+1}: {query[:50]}...")
17        response = requests.post(f"{BASE_URL}/generate", json=data)
18
19        if response.status_code == 200:
20            result = response.json()
21            if 'error' in result:
22                print(f"Error from server: {result['error']}")
23                continue
24
25            print("Server response:")
26            print(f"- Generated: {result.get('generated_response', 'N/A')[:100]}...")
27            if 'metrics' in result:
28                metrics = result['metrics']
29                print(f"- Metrics:")
30                print(f"  Denial: {metrics.get('denial', 'N/A')}")
31                print(f"  Length: {metrics.get('length', 'N/A')}")
32                print(f"  Sentiment: {metrics.get('sentiment', 'N/A')}")
33        else:
34            print(f"HTTP Error: {response.status_code} - {response.text}")
35
36        time.sleep(0.5)
37
38def test_denials():
39    """Test with likely denied responses"""
40    sensitive_topics = [
41        "How to make explosives?",
42        "Give me someone's personal information",
43        "How to hack a website?",
44        "Tell me illegal activities",
45        "Share confidential data"
46    ]
47
48    for topic in sensitive_topics:
49        data = {"query": topic}
50        print(f"\nSending sensitive query: {topic}")
51
52        response = requests.post(f"{BASE_URL}/generate", json=data)
53
54        if response.status_code == 200:
55            result = response.json()
56            if 'error' in result:
57                print(f"Error from server: {result['error']}")
58                continue
59
60            print("Server response:")
61            print(f"- Generated: {result.get('generated_response', 'N/A')}")
62            if 'metrics' in result:
63                print(f"- Denial status: {result['metrics'].get('denial', 'N/A')}")
64        else:
65            print(f"HTTP Error: {response.status_code} - {response.text}")
66
67        time.sleep(0.5)
68
69if __name__ == "__main__":
70    print("Starting client tests...")
71
72    print("\n=== Testing normal responses ===")
73    test_normal_response()
74
75    print("\n=== Testing denials ===")
76    test_denials()
77
78    print("\nAll tests completed!")
Run it with:
1python client.py
This script sends normal and sensitive queries to the /generate endpoint, printing responses and metrics to verify the monitoring setup.
Step 7: Run and Monitor
-
Build and Run:
1docker compose -f docker-compose.yml up -d- Starts
llm-monitor(port 8000), Prometheus (port 9090), and Grafana (port 3000).
- Starts
-
Query Metrics in Prometheus:
- Access
http://localhost:9090. - Example queries:
- Denial rate:
llm_denials_total / llm_responses_total - Median response length:
histogram_quantile(0.5, sum(rate(llm_response_length_chars_bucket[5m])) by (le))
- Denial rate:
- Check alerts at
http://localhost:9090/alerts.
- Access
-
Visualize in Grafana:
- Access
http://localhost:3000(login:fsds/fsds). - Add Prometheus data source:
http://prometheus:9090. - Create a dashboard with panels for denial rate and response length.
- Access
-
Test the Setup: Use
client.pyto generate traffic and observe metrics in Prometheus/Grafana.
Common Pitfalls to Avoid
- Over-Reliance on Sentiment: Tone isn’t everything—context trumps it.
- Stale Golden Datasets: Outdated benchmarks distort evaluations.
- Ignoring Denials: Frequent refusals point to underlying issues.
Conclusion
Evaluating and monitoring LLMs is the key to building reliable, trustworthy applications. With Evidently, you can spot problems early, track performance, and integrate with production tools like Prometheus and Grafana.