1. Introduction
This blog discusses how to effectively interact with popular BI tools by setting up data models for these tools. These BI systems typically rely on structured data extracted from the underlying source system databases. Therefore, structuring the data model before diving into metric calculations and building interactive dashboards with filters efficiently remains a challenge for Data Analysts.
2. Principal steps
2.1 Definition and purpose of data modeling in the context of BI:
In the landscape of Business Intelligence (BI), data modeling stands as a fundamental pillar, essential for harnessing the full potential of organizational data and transforming it into actionable insights. Data model is:
— It is the blueprint for designing a database — They visual representations of an enterprise’s data elements and the connections between them. — visually represents the nature of the data, business rules governing the data, and how the data will be organized in a database. — Defines and structure data in the context of relevant business processes, data models support the development of effective information systems.
2.2 Normalization and denormalization database
Definitions
- Normalization: According to Wikipedia’s definitions, Database normalization is the process of structuring a relational database in accordance with a series of so-called normal forms in order to reduce data redundancy and improve data integrity.
- As the opposite, Denormalization is the inverse process of normalization where the redundancy is added to the data intentionally to improve the performance of the specific application and data integrity. Application in designing schema:
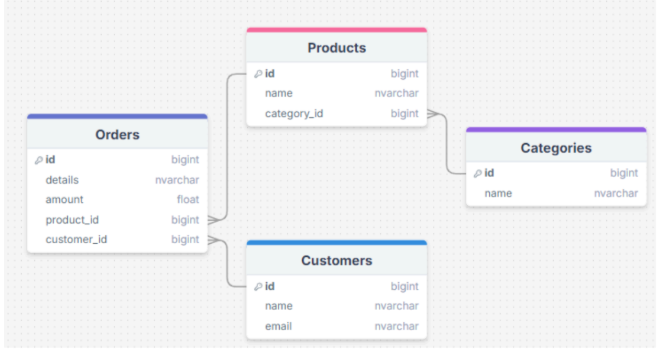
- Normalized: A schema design to store non-redundant and consistent data
- Data integrity is maintained
- Little to no redundant data
- Many tables
- Optimizes for storage of data
 Click to zoom
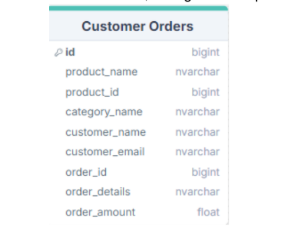
 - Denormalized: A schema that combines data so that accessing data (querying) is fast.
- Data integrity is not maintained
- Redundant data is common
- Fewer tables
- Excessive data, storage is less optimal.
Popular tools: Not all BI tools are created equal. Some are designed for specific purposes, such as data visualization, reporting, or analytics, while others offer a more comprehensive suite of features and functions. Depending on the strategy and data usage orientation of companies, they typically use the following popular BI tools:
- Microsoft Power BI (when the company primarily uses Microsoft services)
- Tableau
- Looker Studio (when the company primarily uses Google services)
- Excel Typically, for BI tools with strong support for modeling, such as Power BI and Tableau, you can use a normalized database. However, for BI tools that do not support data modeling (Looker Studio, Excel,....), you should use a denormalized database to ensure all metrics and dimensions are fully covered. In the following sections, I will delve into data model design for BI tools such as Power BI and Tableau.
2.3 Establish Relationships
Relationships define how tables are connected and interact with each other. They are crucial for maintaining data integrity and ensuring accurate query results. Each entity (table) can potentially have a relationship with every other one, but those relationships are typically one of three types:
- One-to-one relationships:
- A one-to-one relationship (1:1) is a relationship where a record in one table is associated with exactly one record in another table.
- Primary Key as Foreign Key
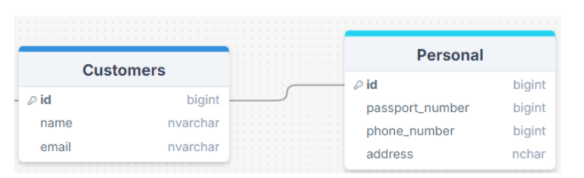
Unless you have a good reason not to, a 1:1 relationship usually indicates that you’d be better off combining the two tables’ data into a single table. However, you might want to create tables with a 1:1 relationship under a particular set of circumstances. If you have a field with optional data, such as “description,” that is blank for many of the records, you can move all of the descriptions into their own table, eliminating empty space and improving database performance. Or if you have sensitive data that needs to be protected for customers and don't want everyone to be able to see it, you can store it in a separate table, grant permissions, and create a 1:1 relationship with the original Customer table. To guarantee that the data matches up correctly, you’d then have to include at least one identical column in each table, most likely the primary key.
- One-to-many relationships (highly recommended):
- One row in a table (usually dimension table) can have a relationship with many rows in another table (usually fact table).
- To implement a 1:M relationship as you set up a database, simply add the primary key from the “one” side of the relationship as an attribute in the other table. When a primary key is listed in another table in this manner, it’s called a foreign key.
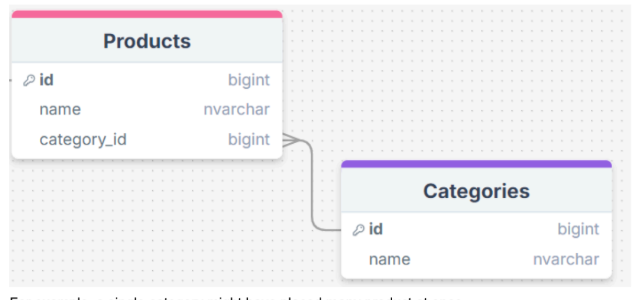
For example, a single category might have placed many product at once.
- Many-to-many relationships (not recommended):
- When multiple entities from a table can be associated with multiple entities in another table, they are said to have a many-to-many (M:N) relationship. This might happen in the case of students and classes, since a student can take many classes and a class can have many students.
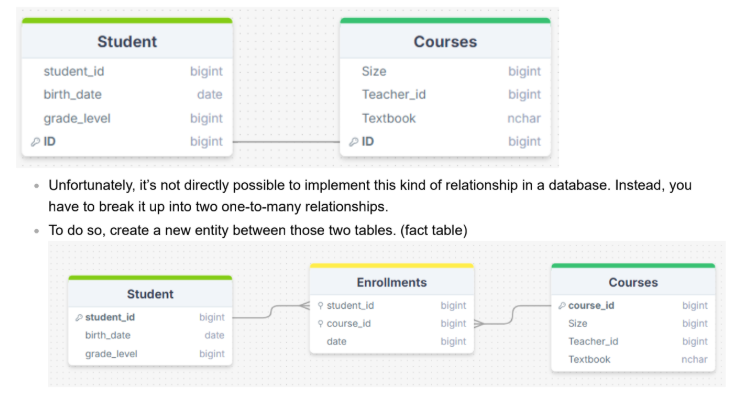
- Unfortunately, it’s not directly possible to implement this kind of relationship in a database. Instead, you have to break it up into two one-to-many relationships.
- To do so, create a new entity between those two tables.
2.4 Database schema types
Typically, the data models built for BI tools are mostly dimensional modeling, which extends logical and physical data models to further model data and data relationship requirements. Database schemas that are modeled according to dimensional modeling principles work well with applications that must read large amounts of data quickly.
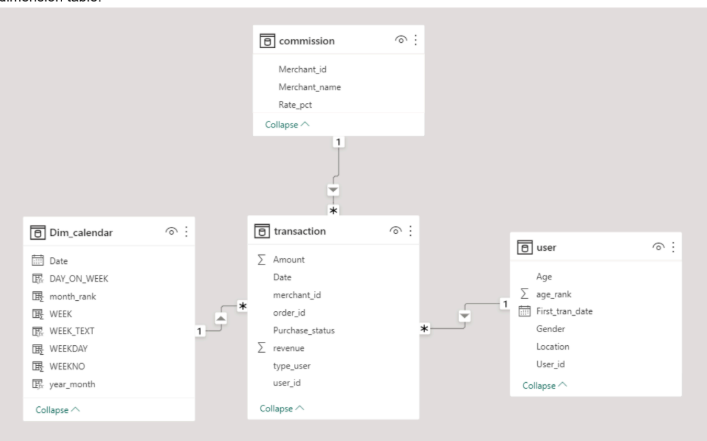
- Star schema: is a type of relational database schema that is composed of a single, central fact table that is surrounded by dimension tables. A star schema can have any number of dimension tables. The branches at the end of the links connecting the tables indicate a many-to-one relationship between the fact table and each dimension table.
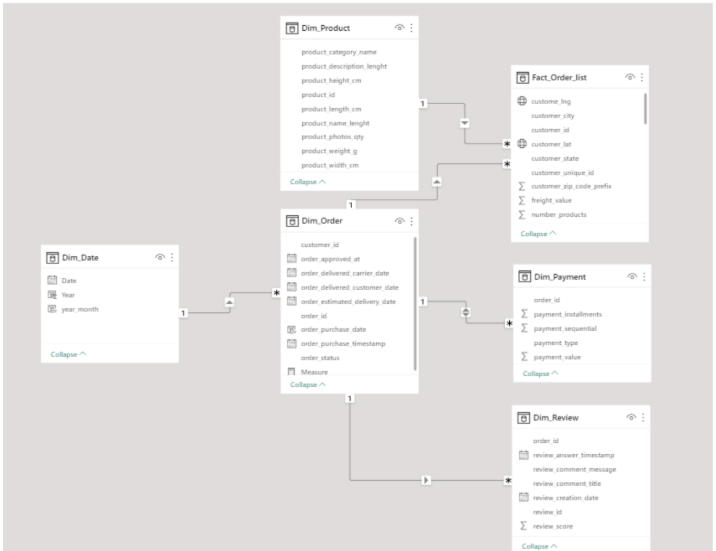
- Snowflake schemas: consists of one fact table that is connected to many dimension tables, which can be connected to
other dimension tables through a many-to-one relationship. Tables in a snowflake schema are usually normalized to the
third normal form. Each dimension table represents exactly one level in a hierarchy.
(Model built by Power BI)
 Click to zoom
Choose the appropriate data modeling technique:
| Star Schema | Snowflake Schema |
|---|---|
| Top-down model | Bottom-up model |
| Less time for query execution | More time for query execution |
| Occupies more space | Uses less space |
| Denormalized is used | Both normalization and denormalization are used |
| Low query complexity | Higher query complexity |
| Less number of foreign keys | More number of foreign keys |
| High data redundancy | Low data redundancy |
| Simple design | Complex design |
| Easy to understand | Hard to understand |
| *Key differences table between star schema and snowflake. | Image: Dilip Kumar Patairya* |
2.6 Optimize Performance
- Index key column (primary key): Columns with high cardinality, such as unique identifiers
- Partition to manage and access subsets of data more effectively
- Materialize to store query results for frequent use.
- Store data in the correct format and character encoding. The default format of the database often allows up to 1000 characters; however, for fields like product_name or merchant_name, 1000 characters are unnecessary. Keeping the default setting consumes a lot of resources, which can slow down reporting.
- Select only the necessary columns from a table for reporting.
2.7 Validate Model
- Ensure that the model meets all business requirements and performs as expected.
- Test it with real queries and evaluating whether it returns accurate and timely results.
3. Conclusion
The data modeling lifecycle in BI projects is a structured and iterative process that encompasses requirement analysis, conceptual modeling, logical modeling, physical modeling, implementation, testing, maintenance, and evolution. A well-structured data model lays the foundation for a BI solution by defining how data is connected, stored, and accessed. Follow the key steps above, to effectively construct a data model tailored for a BI solution, empowering you to unlock the full potential of your data.
References:
- https://www.lucidchart.com/pages/database-diagram/database-design
- https://medium.com/@santosh_beora/database-schemas-star-schema-vs-snowflake-schema-528163c4215d
- https://medium.com/@santosh_beora/dimension-and-fact-tables-b88283c96e0b
- https://medium.com/@gadnwachukwu2/the-basics-of-data-modeling-in-business-intelligence-652254020d0d
- https://builtin.com/articles/star-schema-vs-snowflake-schema#:~:text=If%20you%20have%20a%20few,will%20be%20a%20better%20scheme.
- https://www.lucidchart.com/pages/database-diagram/database-design